This article will discuss Power BI Optimization techniques to apply performance tunning on Power BI Reports.
Power BI is a visualization tool that uses a unified and scalable platform for self-service and enterprise business intelligence that’s easy to use and helps organizations with deeper data analysis. Power BI has been gaining popularity in the recent era. However, power bi consultants face difficulty producing and maintaining the optimized solution. This article discusses different techniques to maintain the required optimization in Power BI.

Power BI Optimization can be applied to Visualization, ETL, Data Models, and DAX Layers:
Power Bi Optimization using Visualization Layer
We can achieve Power Bi Optimization by using applying different techniques on the visualization layer (Power BI Reports). Below is the list of some techniques:
Limit Visuals on Power BI Report
The number of visuals placed on the Power BI report should be minimum. Use Drill through and Tooltip features as an alternative.
Limit Data by Applying Filters
Don’t leave filters with default values (All) for visuals; apply the most restrictive filters on a page or visual level such as today, yesterday, Current Week etc for Date filters.
Performance Evaluation of Custom Visuals
Evaluate the performance of custom visuals if they are mandatory for visualization and if no OOTB visual is available for their replacement.
Power BI Paginated Reports
Power BI Paginated Reports are optimized to load the larger dataset in Grid/Matrix visual, printing, and PDF generation.
Optimize Power BI Reports using ETL & Data Model Layer
In this section, we will discuss power bi-optimization techniques that can be applied to ETL and Data Model layers.
Denormalize Data with Star Schema
Data Denormalization is the first optimization applied to a data model. Every relationship has a memory cost and an additional overhead when the engine transfers the filter from one table to another.
To achieve better performance, we should consider the STAR Schema during the development of the data model.
Limit Data Model
The fastest way to optimize the Power BI data model is to limit the number of columns that are required for analysis or need to create a relationship with other tables in the model.
Optimize Column Data Type
By design, the numeric column data type achieves the highest performance. Numeric columns use value encoding.
Text and other non-numeric data types use a hash encoding. It requires the storage engine to assign a numeric identifier to each unique text value contained in the column, so it’s better to convert the text column into numeric type if possible, e.g., when the column has True or False text. It can be transformed into 0 and 1 values.
Data Precision
Store data in required precision only, e.g., if the analysis is required on a minute level, then you can save memory by removing seconds and milliseconds from the time column.
Split Column to reduce Data Dictionary
Sometimes splitting of columns reduces the data dictionary size, which helps to optimize the data model. E.g. the DateTime column is a very common example, and you can achieve optimization by splitting a single DateTime column into Data and time columns. Also, if there is no need for time, you can only convert the DateTime column to the date column.
Reduce Dimension Cardinality
Try to reduce dimension records; however, if impossible, you must reduce cardinality for some attributes. E.g., suppose the model has more than 1 million customers. In that case, you need to identify some attributes which are required for analysis but have low Cardinality and create a separate dimension for selected attributes.
Aggregate Tables for Larger Facts
Create aggregate tables on different granularity if Fact has billion of rows.
Table Partitioning
For larger facts, you need to partition the fact table if using the Power BI Premium or Azure Analysis Services. Each partition should consist of 8 million or fewer rows for best performance.
Optimize Power BI Reports using DAX
Dx is the heart of Power BI solutions, and most performance issues can be resolved by optimizing Dax. Here is the list of some Dax examples which can be used in solutions for Power BI Optimization at the DAX layer:
Use of Divide Function
The divide is an optimized function to perform division instead of using “/” with the IF statement to validate the denominator.
Use of Filter Conditions
Use Column to filter the CALCULATE/CALCULATETABLE function instead of using the table in the filter argument.
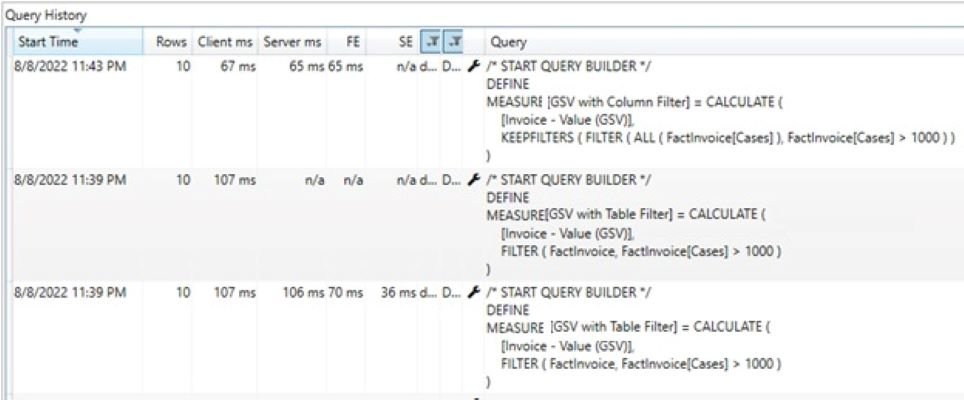
In the above example, “GSV with Column Filter” Dax performs 40% better than “GSV with Table Filter” by using a column filter instead of a table filter in Calculate function.
Reducing Context Transitions
The storage engine can only compute simpler grouping, such as aggregations and grouping over columns; however, Formula Engine is responsible for all other computations. Suppose the expression computed during the iteration is simple for the storage engine. In that case, performance is typically good otherwise large data cache and/or high frequency of CallbackDataID might occur CallbackDataID is a call between the storage engine and the formula engine. CallbackDataID can slow down the storage engine execution and disables the use of the storage engine cache for the data cache produced. Removing this can optimize the query execution.
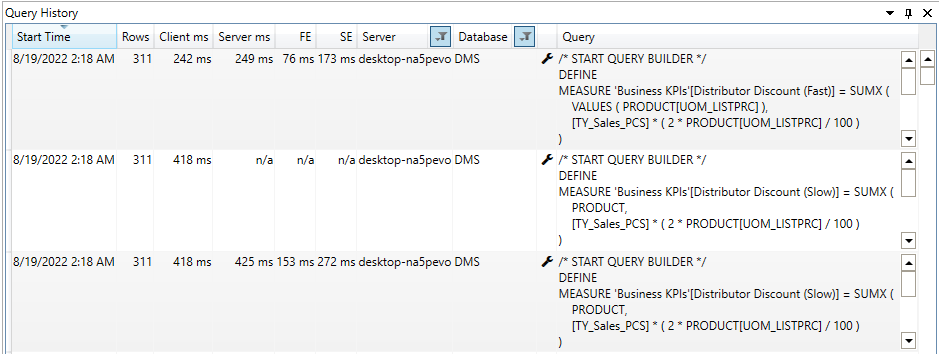
In the above example, Dax “Distributor Discount “[Slow]” is slow due to the transition between the storage engine and formula engine for each row of the product table; however, in the “Distributor Discount [Fast]” measure, the transition has occurred for only distinct values of column DimProduct[UOM_LISTPRC]. We are gaining 42% performance by reducing the number of transitions between SE (Storage Engine) and FE (Formula Engine).
Use of Variable (VAR) to Avoid Multiple Evaluation
When the same sub-expression needs to be evaluated multiple times in DAX Expression, it is a good idea to store the result of the sub-expression in a variable and point out the variable in DAX Expression. The use of variables is a best practice that improves code readability and performance and also helps developers debug the issue
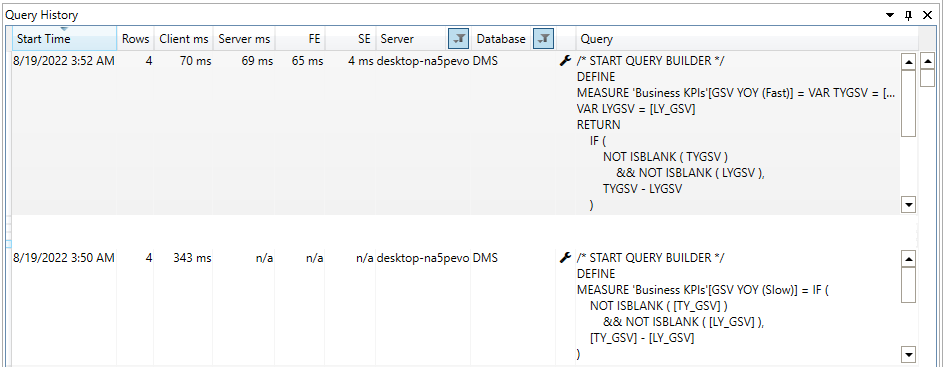
We get 80% performance by using “VAR” to calculate the YOY measure in the above example.
Avoid Nested Iterators
Only the innermost iterator can be executed in a single storage engine query when there are nested iterators in DAX. The outer iterators require additional storage queries or larger materialization, so we should try to minimize the nested iterators using summarize and other functions.
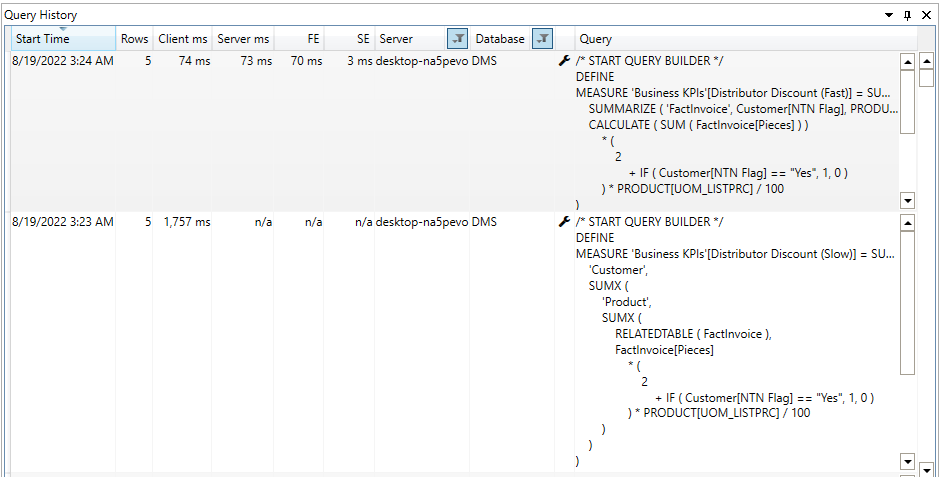
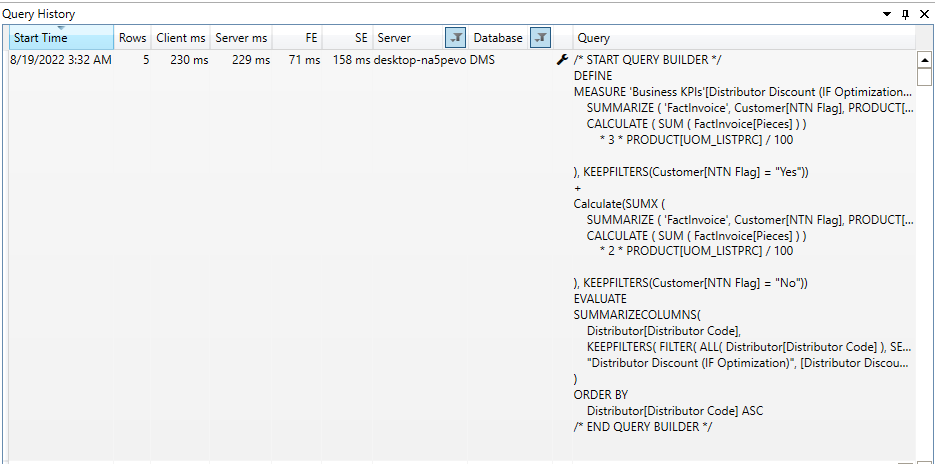
In the “Distributor Discount (Slow)” measure, we are getting the distributor discount by using Nested Dax operators; however, in “Distributor Discount (Fast)”, we eliminate the nested iterators by using Summarize function and are getting 99% faster execution. Please note that this percentage can be changed for your data mart due to the number of records in dimensions, fact table, and filters applied.
Avoid IF in Iterators
Avoid using the IF statement in a larger iterator, as it will exchange calls between the storage and formula engines, which might be expensive for overall query execution. Please note that the “IF” function is always executed by FE.
In the previous example, we used the “IF” statement to evaluate the Dax expression. In the above example, we converted the logic to replace the “IF” statement. Please note that execution time is increased in the above example. Still, we should try to eliminate the “IF” statement, compare the results on different parameters, and then decide.