Implementing Dimensions
Before reading this article, we will recommend you go through part(1) of this series: Implementing star schema in jupyter notebook part(1)
In the first part, we perform a basic data analysis now; we will transform our data to make it useful for creating dimensions, lookups, and facts.
#create schema for your dataframe
schema = StructType(
                   [StructField("SalesDate", DateType(), True)\
                   ,StructField("SalesQty",IntegerType(), True)\
                   ,StructField("SalesAmount", FloatType(), True)\
                   ,StructField("ProductCategory", StringType(), True)\
                   ,StructField("ProductSubCategory", StringType(), True)\
                   ,StructField("ProductName", StringType(), True)\
                   ,StructField("StoreName", StringType(), True)\
                   ,StructField("StoreRegion", StringType(), True)\
                   ,StructField("StoreProvince", StringType(), True)\
                   ,StructField("StoreZone", StringType(), True)\
                   ,StructField("StoreArea", StringType(), True)\
                   ,StructField("PaymentTerms", StringType(), True)\
                   ,StructField("SalesMan", StringType(), True)\
                   ,StructField("Route", StringType(), True)\
                   ,StructField("Category", StringType(), True)
                   ]
                   )
we are defining the new schema for our above dataset to prevent mismatching of data types while creating a spark dataframe. It is considered as best practice.
df2 = spark.createDataFrame(df,schema=schema)df2 is a spar dataframe that is created from the previous dataframe df, and the schema that we defined earlier can be used, which maps the column of df dataframe into one described in our schema
df2.dtypes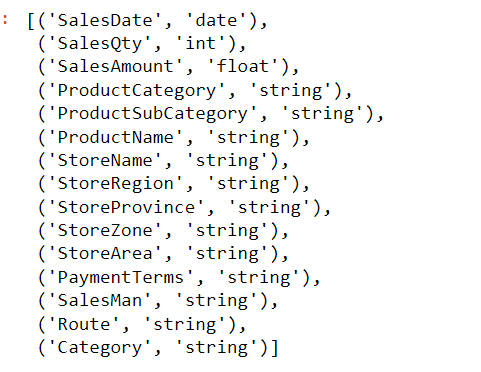
Dim Product
df2.createOrReplaceTempView('dim_product')
spark.sql('select ProductCategory,ProductSubCategory,ProductName from dim_product')
To construct a temporary view or table from a Spark DataFrame or Dataset object, use the createOrReplaceTempView () function. The table and view duration depends on the active SparkSession because they are temporary views. As a result, it will be eliminated immediately when your spark session expires.
In the second statement, we select ProductCategory, ProductSubCategory, and ProductName columns from the df2 spark dataframe, which seems to be part of the product dimension.
dimproduct = spark.sql('select ProductCategory,ProductSubCategory,ProductName from dim_product').distinct()When it comes to the dimension, we always store rows containing a unique value; for this purpose, a distinct function will remove the duplicate values.
dimproduct.show()
dimproduct = dimproduct.withColumn('productID', row_number().over(Window.orderBy(monotonically_increasing_id())) )This line of code will generate a unique id for rows that are present in the dim product dataframe.
dimproduct.show()
dim_Product = dimproduct.toPandas()
dim_Product.to_excel('C:/Users/mycomputer/Downloads/dim_product.xlsx',header=True ,index=False)
In this above code, we will store the dim product i.e., the dimension of the product dataframe, in an excel sheet
we will repeat the same steps for other dimensions as well
Dim Store
df2.createOrReplaceTempView("dim_store")
dimstore = spark.sql('select StoreName,StoreRegion,StoreProvince,StoreZone from dim_store').distinct()
dimstore = dimstore.withColumn('StoreID', row_number().over(Window.orderBy(monotonically_increasing_id())) )
dim_store = dimstore.toPandas()
dim_store = dim_store.reindex(columns = ['StoreID' , 'StoreName' ,'StoreProvince' ,'StoreRegion' , 'StoreZone' ])
dim_store.to_excel('C:/Users/mycomputer/Downloads/dim_store.xlsx',header=True ,index=False)
Dim Dealer
df2.createOrReplaceTempView("dim_dealer")
dimdealer = spark.sql('select SalesMan,Route from dim_dealer').distinct()
dimdealer = dimdealer.withColumn('DealerID', row_number().over(Window.orderBy(monotonically_increasing_id())))
dim_dealer = dimdealer.toPandas()
dim_dealer = dim_dealer.reindex(columns=['DealerID', 'SalesMan' ,'Route'])
dim_dealer.to_excel('C:/Users/mycomputer/Downloads/dim_dealer.xlsx',header=True ,index=False)
Dim date
def create_date(start='2010-01-01', end='2050-12-31'):
    df = pd.DataFrame({"date": pd.date_range(start, end)})
    df["day"] = df.date.dt.day
    df["month"] = df.date.dt.month
    df["week"] = df.date.dt.isocalendar().week
    df["quarter"] = df.date.dt.quarter
    df["year"] = df.date.dt.year
    df.insert(0, 'date_id', (df.year.astype(str) + df.month.astype(str).str.zfill(2) + df.day.astype(str).str.zfill(2)))
    return df
This method will generate a dim date based on starting and ending date.
dim_date = create_date()
dim_date.to_excel('C:/Users/mycomputer/Downloads/thtechiest/dim_date.xlsx',header=True ,index=False)
Look up (lookup payment)
df2.createOrReplaceTempView("lkp_payment")
lkp = spark.sql('select PaymentTerms from lkp_payment').distinct()
lkp = lkp.withColumn('PaymentID', row_number().over(Window.orderBy(monotonically_increasing_id())))
lkp_Payment = lkp.toPandas()
lkp_Payment.to_excel('C:/Users/mycomputer/Downloads/lkp_payment.xlsx',header=True ,index=False)
Fact Tables
The main table in a data warehouse’s star structure is called a fact table. A fact table is frequently denormalized and is used to hold quantitative data for analysis. Dimension tables can be used with a fact table. A dimension table contains information on the various ways the fact table’s data can be studied, while a fact table contains the data that will be evaluated. The fact table thus has two different kinds of columns. The dimension tables can be joined using the foreign keys column, and the data being analyzed is in the measures columns.
Difference between Dimensions and Facts Table
- The Dimension table is a companion to the fact table and includes descriptive qualities to be used as query constraints. The fact table contains measurements, metrics, and facts about a business process.
- A star or snowflake schema’s core is where the fact table is located, while its borders are where the dimension table is situated.
- A dimension table should be lengthy, detailed, full, and of guaranteed quality, while a fact table is characterized by its grain or most atomic level.
- While the Dimension database includes extensive information, the Fact table holds report labels.
- In contrast to the Dimension table, which incorporates hierarchies, the Fact table does not.
Implementing Fact Table
We perform a basic data analysis in the first section, then split the dimensions and look up from the staging table in the above section. We will now produce a fact table for the scenario that was provided in the first part. The Star schema concept is clearly defined in this article in detail: star schema
Temp Table Creations
dimp= spark.createDataFrame(dim_Product)
dimp.createOrReplaceTempView('dimp')
dim_Product is a dataframe created earlier, and then we create a temporary table dimp which we will use later on to make a query. we will perform the steps for other dimensions we created earlier.
dimstore = spark.createDataFrame(dim_store)
dimstore.createOrReplaceTempView('dimst')
dimd = spark.createDataFrame(dim_dealer)
dimd.createOrReplaceTempView('dimd')
lkp= spark.createDataFrame(lkp_Payment)
lkp.createOrReplaceTempView('lkp')
dk = spark.createDataFrame(dim_date)
dk.createOrReplaceTempView('dk')
we will create the temp table, i.e., ‘sales’ for the dataframe we created in Implementing star schema part(1) to join the dimension and create a fact table.
df.createOrReplaceTempView('sales')Now we will join each dimension and look up the table together through the query mentioned here.
Fact Sales Query
fact = spark.sql('select s.SalesQTY , s.SalesAmount , dp.productID , ds.StoreID , dd.DealerID ,lkp.PaymentID ,dk.date_id from sales s inner join dimp dp on s.ProductCategory = dp.ProductCategory and s.ProductSubCategory = dp.ProductSubCategory and s.ProductName = dp.ProductName inner join dimst ds on s.StoreName = ds.StoreName and s.StoreRegion = ds.StoreRegion and s.StoreZone = ds.StoreZone inner join dimd dd on s.SalesMan = dd.SalesMan and s.Route = dd.Route inner join lkp on s.PaymentTerms = lkp.PaymentTerms inner join dk on s.SalesDate = dk.date')This query creates a dataset by joining dimension and fact table through inner join based upon foreign keys.
Fact Sales Table
fact_sales= fact.toPandas()
fact_sales.to_excel('C:/Users/mycomputer/Downloads/assignment2/fact_sales.xlsx',header=True ,index=False)
You can store it in an excel file and verify if the data populated here is correct by matching values in dimension tables. The last part here has been concluded; if you find any difficulty, you can ask in the comment