We advise you to read parts (1) and part(2) of this series before continuing with this article: star schema part(1), star schema part(2)
We perform a basic analysis of the data in the first section, and then we split the dimensions and look up from the staging table in the second section. We will now produce a fact table for the scenario that was provided in the first part. The Star schema concept is clearly defined in this article in detail: star schema
The main table in a data warehouse’s star structure is called a fact table. A fact table is frequently denormalized and is used to hold quantitative data for analysis. Dimension tables can be used with a fact table. A dimension table contains information on the various ways the fact table’s data can be studied, while a fact table contains the data that will be evaluated. The fact table thus has two different kinds of columns. The dimension tables can be joined using the foreign keys column, and the data being analyzed is in the measures columns.
Difference between Dimensions and Facts Table
- The Dimension table is a companion to the fact table and includes descriptive qualities to be used as query constraints. The fact table contains measurements, metrics, and facts about a business process.
- A star or snowflake schema’s core is where the fact table is located, while its borders are where the dimension table is situated.
- A dimension table should be lengthy, detailed, full, and of guaranteed quality, while a fact table is characterized by its grain or most atomic level.
- While the Dimension database includes extensive information, the Fact table is used to hold report labels.
- In contrast to the Dimension table, which incorporates hierarchies, the Fact table does not.
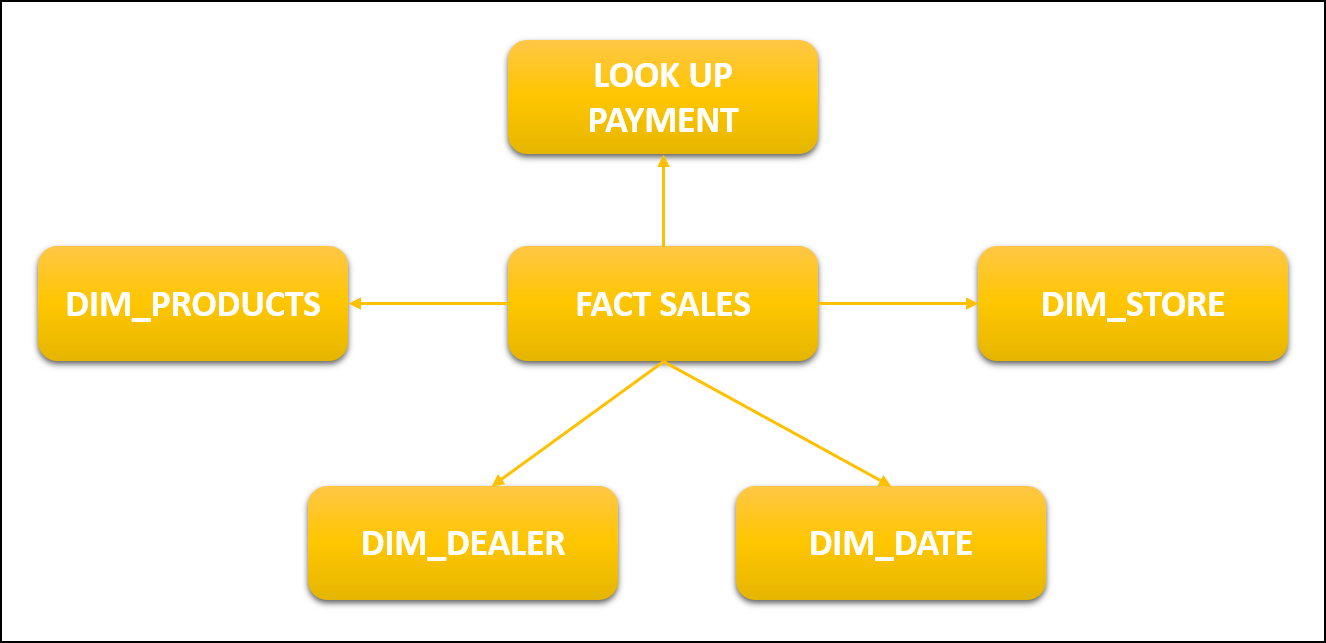
FACT SALES
dimp= spark.createDataFrame(dim_Product)
dimp.createOrReplaceTempView('dimp')
dim_Product is a dataframe that has created earlier in part(2) and then we create a temporary table dimp which we will be using later on to make a query
we will read the dataframe just like we did earlier and we will convert it into temp view.
df = pd.read_excel('C:/Users/mycomputer/Downloads/IcecreamDataset.xlsx')
df.createOrReplaceTempView('sales')
dimstore = spark.createDataFrame(dim_store)
dimstore.createOrReplaceTempView('dimst')
dimd = spark.createDataFrame(dim_dealer)
dimd.createOrReplaceTempView('dimd')
lkp= spark.createDataFrame(lkp_Payment)
lkp.createOrReplaceTempView('lkp')
dk = spark.createDataFrame(dim_date)
dk.createOrReplaceTempView('dk')
Now we will join each dimension and look up the table together through the query mentioned here. sales is actually the actual data frame we created in the first lesson of the star schema. you can see here the star schema part(1),
fact = spark.sql('select s.SalesQTY , s.SalesAmount , dp.productID , ds.StoreID , dd.DealerID ,lkp.PaymentID ,dk.date_id from sales s inner join dimp dp on s.ProductCategory = dp.ProductCategory and s.ProductSubCategory = dp.ProductSubCategory and s.ProductName = dp.ProductName inner join dimst ds on s.StoreName = ds.StoreName and s.StoreRegion = ds.StoreRegion and s.StoreZone = ds.StoreZone inner join dimd dd on s.SalesMan = dd.SalesMan and s.Route = dd.Route inner join lkp on s.PaymentTerms = lkp.PaymentTerms inner join dk on s.SalesDate = dk.date')This query creates a dataset by joining dimension and fact table through inner join based upon foreign keys.
fact_sales= fact.toPandas()
fact_sales.to_excel('C:/Users/adil/Downloads/assignment2/fact_sales.xlsx',header=True ,index=False)
You can store it in an excel file and verify if the data populated in here is correct by matching values in dimension tables. The last part here has been concluded if you find any difficulty you can ask in the comment
Implementing star schema part(1)